
Download a free financial plan template
Understanding the importance of financial statements for business owners and key stakeholders
One engages in business to make profits. Therefore, a company must prepare its financial statements to know if it is making money. And it is to the advantage of the business owners to understand the financial statements prepared by their bookkeeper or accountant.
Before discussing what financial statements are to business owners, let us first identify other parties who use these reports.
Creditors. Those who lend money by financing assets like the company’s warehouse, factory, or machinery would like to know if the company can repay its loans. For this, creditors will need the company’s financial statements.
Suppliers. Similarly, suppliers who sell on credit will also be interested in determining the company’s ability to pay based on the credit terms. Suppliers can use the financial statements to make this assessment.
Customers. The company’s clients who may be looking at a long-term relationship, including those buying items that may be covered by warranty or may need subsequent services, will prefer to deal with a financially stable company.
Government Agencies. Government agencies use financial statements to determine the taxes a company owes.
Employees. Even employees who may be considering joining a company can check if this company will likely be in the business for a long time with cash to pay salaries.
Competitors. Competitors may likely check the company’s financial statements to compare their financial performance.
Investors. The owners or other investors/partners he may invite will want assurance that the return on investment will be acceptable.
As a business owner, you want to know how much income you generate. Moreover, you will also benefit from knowing other factors that will help you make business decisions. Financial statements are essential tools you may use for this purpose.
Some business owners may say, “But I’m not a number person. So how can I understand these financial statements?”
This article aims to help business owners, especially those who call themselves ‘not a number person,’ understand the value of these financial statements.
The three (3) primary financial statements a company prepares are Balance Sheet, Income Statement, and Cash Flow Statement.
Understanding the Balance Sheet
Balance Sheet is a list of the company’s resources (assets) and who funded these assets, which are either through loans (liabilities) or owner’s investment (equity). The Accounting Equation to the Accountant is Assets = Liabilities + Owner’s Equity. Therefore, for every asset the company acquires, we should also record the equivalent source of funds.
For a simple illustration, this Accounting Equation is similar to purchasing a house funded partially by bank borrowings. For example, say you bought a 500,000 € worth of house and lot. Your equity is 100,000 €. You secured a bank loan of 400,000 € payable within 20 years to cover the balance. This transaction is as follows: House and Lot of 500,000 € = Loan of 400,000 € + Equity of 100,000 €
To understand this further, let’s use a sample company. ReneOffice.Solutions, a start-up company, sells innovative office chairs.
At the start of Year 1, the owner infused cash of 75,000€. We note that at the beginning of Year 1, the total assets of 75,000 € (Cash) is equivalent to the total equity of 75,000 € (Capital) since there was no reported obligation. The table below presents the resulting Balance Sheets for the next 5 years.
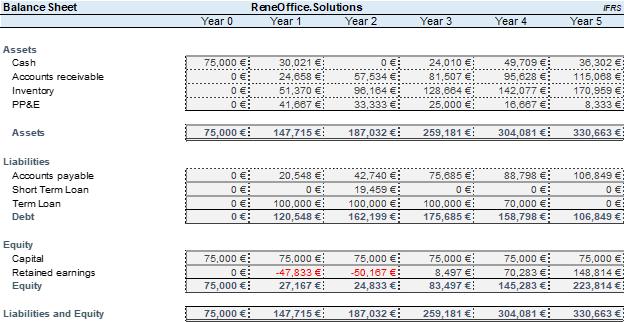
Over the next five years, we see movements in the various items in the company’s assets and liabilities plus equity. True to its name, a Balance Sheet is a report which shows that the Total Assets of the company are balanced with the Total Liabilities and Owner’s Equity.
Let us examine the movement of the various accounts in our comparative balance sheets.
First are the Assets:
Cash. From the initial cash of 75,000 € on Day 1, we see that the ending balance in Year 1 amounted to 30,021 €. This turned zero in Year 2, then increased with ending cash of 36,302 € in Year 5. The change in the cash balance will be better explained when we discuss the third basic financial statement, the Cash Flow Statement.
Accounts Receivable. Accounts Receivable refers to our collectibles from customers from sales of goods and services that still need to be paid.
Inventory. These are goods available for sale or chairs yet to be sold as of the end of the year.
Cash, Trade Receivable and Inventory are identified as Current Assets. Current Assets are the company’s resources that will likely be converted to Cash within one year. In addition, Accounts Receivable are expected to be collected, and Inventory are anticipated to be sold within one year.
Plant, Property and Equipment or PPE. This refers to fixed assets of the company, such as Store and Office Equipment, which are not for sale and are not expected to be converted to cash within the year. Instead, we assess that these assets will be useful to the company for the next six years. Assets that will not be converted to cash within one year and are for the company’s use in doing its business for more than one year are tagged as Non-Current Assets. .
TOTAL ASSETS. This is the total of all the assets of the company. This refers to everything the company owns and uses in business operations.
Next are the liablities:
Accounts Payable. Accounts Payable represents the amount we owe our suppliers of the goods and services we sell and other expenses we used for the business but have yet to pay as of the end of the year.
Short Term Loan. A company may avail of a credit line from banks and other creditors in case there is a need for additional funds to support the business. This is expected to be paid within one year from availment.
Accounts Payable and Short Term Loan are treated as Current Liabilities as these obligations are payable within one year from the Balance Sheet date.
Term Loan. For this illustration, we assumed that the Bank Loan would be paid in Year 4 (30,000 €) and Year 5(70,000 € ). All obligations payable beyond one year are accounted as Long-Term Liabilities or Non-Current Liabilities.
TOTAL LIABILITIES. This is composed of the current liabilities and non-current or long-term liabilities. This is the total amount a company owes to others.
Last the equity:
Retained Earnings. Net income after tax is booked as Retained Earnings. It is the cumulative amount of profits that are generated and maintained or kept in the business. With that, Retained Earnings will increase if additional net income is earned. On the other hand, there will be a decrease in retained earnings if the company reports a negative net income (or net loss) or if the owner withdraws some of their investment from the accumulated earnings.
Capital. This account represents the amount invested in the company by the Business Owner. Hence, it is equivalent to the money attributable to the owner.
Total or Owner’s Equity is the combination of Retained Earnings and Owner’s Capital. It is the share of the business that belongs to the owner or owners. It is also referred to as the company’s book value or net worth. It is the residual value of a company’s assets after all obligations are deducted.
Understanding the Income Statement
INCOME STATEMENT. This statement reports how much profit/money the business is generating. In it, we see revenues or sales and expenses deducted from these sales or revenues. The difference is called net income if it is a positive and net loss if negative.
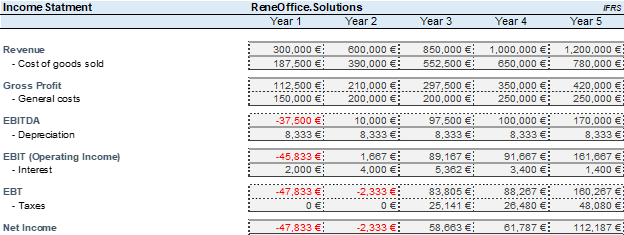
In Year 1, ReneOffice.Solutions generated 300,000 € revenues and a net loss of -47,833 €. Revenue will increase for the succeeding years, ending with 1,200,000 € in Year 5.
Sales. Sales or Revenue are what we generate from doing business. For ReneOffice.Solutions, it is the proceeds from selling innovative office chairs.
Cost of Goods Sold. The Cost of Goods Sold or Cost of Sales is what we directly incur to have the merchandise or service we will offer our customers. In this sample company, it is the amount we paid or will pay to produce the office chairs from an supplier, including all shipping and other related costs. In our case, we resell the item as it was when we bought them. Some companies may have to do other processes to produce the final product for sale. As such, additional production and incidental costs will be included in the Cost of Goods Sold.
Gross Profit. This is the difference between Sales or Revenue and Cost of Goods Sold/Cost of Sales. It shows us the margins between the selling price and the direct cost of items or services we are selling.
Operating Expenses. This refers to the cost we incur to run, operate and manage the business. For our company, it includes the general and administrative expenses such as salary of the employees; the rent we pay for the warehouse, store, and office space; the cost of water, electricity, communication, and other utilities we use for the business and all other expenses related to the company as well as the cost of the depreciation of the Plant, Property, and Equipment.
EBITDA, as presented in the table, is Earnings Before Interest, Taxes, Depreciation and Amortization.
A Depreciation Expense of 8,333 € per year is reported in the Income Statement. This is because it was used to generate sales for that period. In addition, Accumulated Depreciation of 8,333 € per year is reported in the Balance Sheet to record the deduction in the useful life of these assets, or shall we say the equivalent wear and tear as these were used in the business. Depreciation Expense is computed as follows: Depreciation Expense = Cost / number of useful life ( 50,000 € / 6 years = 8,333 €)
Operating Income. This refers to the difference between gross profit and operating expenses. It is also referred to as Earnings Before Interest and Tax (EBIT).
Net Income Before Tax or Earnings Before Tax (EBT). This is the amount left after adding/deducting non-operating income/expenses from the Operating Income. Non-operating items are those revenues or expenses that are not part of the company’s primary operations. These may include interest income, interest expenses, and gain or loss from equipment sales, among others. Interest income may include interest earned from cash deposited in the banks. Interest expense, as in the case of ReneOffice.Solutions, refers to the financing cost of borrowing.
Net Income or Net Profit. This is the final amount earned from the business after the corresponding tax is deducted. This is added to the company’s retained earnings. If the amount is negative or a net loss, it will reduce the company’s retained earnings. We note that the company reported losses in Year 1 (47,833 €) and Year 2 (2,333 €). The company recovered with positive net income in the succeeding years – 58,663 € (Year 3), 61,787 (Year 4), and 112,187 € (Year 5).
Understanding the Cashflow Statement
The Cash Flow Statement tells us how cash moved in the business during a specific period. It shows the beginning cash balance, how much money went in and out of the company, and the ending cash balance.
Presented below are the comparative Cash Flow Statements for the next five years
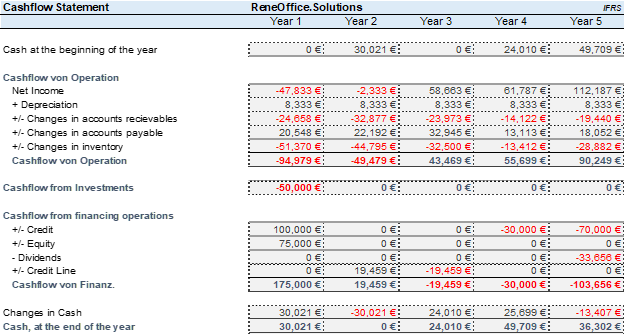
Our sample company, ReneOffice.Solutions, started with 75,000 € Cash at the start of Year 1 and ended at 30,021 € at the end of Year 1.
The resulting Cash at the end of each year in the Cash Flow Statement should equal the Cash balance reported in the Balance Sheet. ReneOffice.Solutions reported Cash of 30,021 € in the Balance Sheet as of Year 1, the same amount of Cash at the end of Year 1 shown in the Cash Flow Statement. This is true for the succeeding four years.
ReneOffice.Solutions reported revenues of 300,000 € because this is the sales for the year. However, it only collected 275,342 € payments during the year, with a balance of 24,658 € reported as Accounts Receivable in the Balance Sheet. Moving forward to the next four years, ReneOffice.Solutions will continue to sell on credit. On average, payments are collected within 35 days.
The cash flow statement has three parts: Cash Flows from Operations, Cash Flow from Investing Activities, and Cash Flow from Financing Activities.
Cash Flows from Operations. This shows what you make and spend in the ordinary course of doing business. This starts with net income.
In the case of ReneOffice.Solutions, and true to all other companies, we added Depreciation to the net income. Depreciation is a non-cash expense because there was no cash out to the company when we booked this expense.
We also reviewed the movement of all current assets and current liabilities. For Year 1, the increase in Accounts Receivable of 24,652 € is deducted because while this is already part of the revenues reported for the month, there is still no cash inflow to the company. In addition, we subtracted the 51,370 € increase in inventory as this means there was cash used to purchase the office chairs being sold. The increase in Accounts Payable is added because it means that the cash to be used to pay this obligation is still with the company. On average, its suppliers give the company 40 to 50 days of credit terms.
For each year, Depreciation is added back to the net income. Meanwhile, all increases in Current Assets are deducted while all decreases are added back. On the other hand, all increases in Current Liabilities are added back while all reductions are deducted. The resulting amount is the Cash Flow from Operations.
Cash Flow from Investing Activities. This covers the money used for investment.
A company usually invests in long-term assets that will be used in business operations for more than one year. For ReneOffice.Solutions, there was an initial investment of Property, Plant, and Equipment (PPE) amounting to 50,000 € in Year 1, which reduced the available cash from the company. This is the Cash Flow from Investing Activities in Year 1.
No additional investment is made in Year 2 to Year 5. However, if there is an additional purchase, it should be a deduction for that year. Also, if any of these long-term assets or PPE is sold, the sale will be considered as the cash flow from selling long-term assets, which will bring in additional cash to the company.
Cash Flow from Financing Activities. This includes the owner’s money invested in the company and loans availed or paid during the period.
For Year 1, this consists of the 75,000 € cash invested by the owner and the 100,000 € Term Loan availed, which increased the company’s cash position.
For Year 2, there is an additional credit loan amounting to 19,459 €. The substantial loss in Year 1 resulted in tight liquidity for the company. It has to borrow to cover its operating costs.
For Year 3, the credit loan availed in Year 2 is paid. Thus, a deduction to the Cash Flow from Financing Activities is reported.
In Year 4, the 30,000 € partial payment to the 100,000 € Term Loan is recognized and reported as a deduction.
In Year 5, payment of the 70,000 € balance is reported as a deduction. There is also a 33,656 € Dividends declared. Cash Dividends are similar to withdrawals of the owners. This is also a reduction in the cash balance of the company.
Key Highlights
- Financial Statements give us a report of the business activities and the resulting financial performance of a company. They provide a basis for the business owner to introduce the plan of action and strategies based on these financial statements.
- There are three (3) basic financial statements. These are the Balance Sheet, Income Statement, and Cash Flow Statement.
- The Balance Sheet informs us how much the company is worth or its value at a specific time. In addition, we see company resources, funding sources, and what will be left to the owner if all obligations are paid.
- The Income Statement summarizes all revenues generated over a period, the corresponding expenses to generate such revenues, and the resulting net profit to the company after all expenses are deducted.
- The Cash Flow Statement tells us what happened to cash during a specified period, providing details about where cash was received and spent.
- Positive Cash balance will not always mean that the company is profitable, just as a negative cash position will not automatically indicate that the business is losing money. Similarly, a positive net income will not necessarily report a positive cash balance, just as a net loss will not spontaneously show a negative cash balance.
- The accuracy of financial statements depends on the integrity of the information used to prepare these statements. The financial statements will also be inaccurate if a company’s accounting records are incomplete and erroneous.
A business owner may not be a number person. But he doesn’t have to be to appreciate the numbers he sees on his financial statements. These numbers tell us what is happening in the business and what to do to achieve our goals.