Introduction
I share my templates free of charge to provide you quickly with an excellent structure upon which to build.
This model represents the most basic form of a 3-statement financial model.
A three-statement model includes the income statement, cash flow statement, and balance sheet. The model is already linked, so changes in the income statement impact the cash flow statement and balance sheet.
Please use this model as a basic structure for your models. I did not lock the file, so feel free to make your adjustments.

Financial Plan Structure
This Excel template file is divided into three parts.
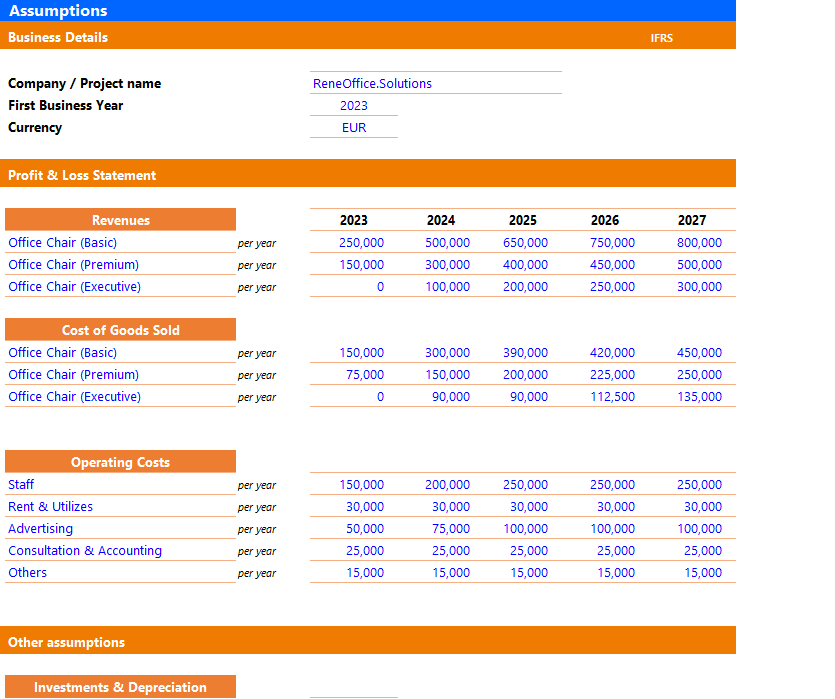
1) Assumption Page
This is the only area in the file where you input your data. The model includes the most basic set of assumptions. Unfortunately, it’s quite universal and not tailored to any particular type of business. You would need to make your own calculations for Revenue or just enter estimations.
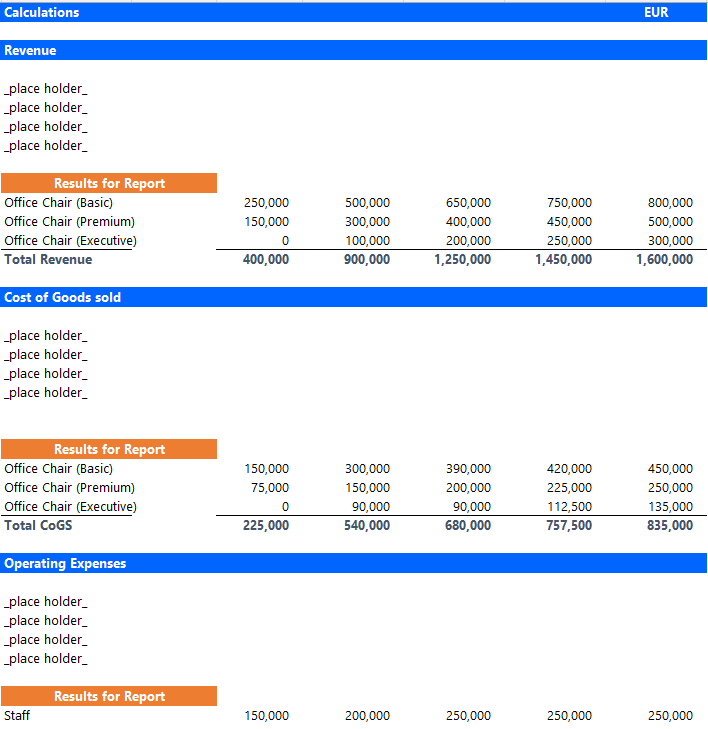
2) Calculation Page
We put all our calculations in this area. I already added basic calculations regarding depreciation, working capital and credits. Feel free to make your own calculations in the different segments; I already added placeholders. Read “How to adjust the template” for more details.
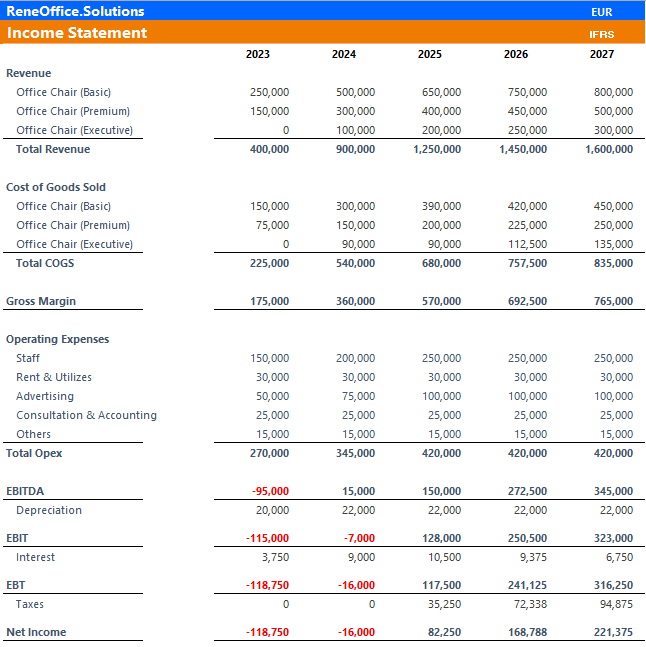
3) Statements
This is the output of the model, which, in our case, is the three financial statements. On this sheet, usually, no heavy calculations are done. It’s only the linkage to the calculation sheet.
Template as a Starting point
Do it yourself:
- Please use these templates as starting points and adjust them to the needs of your business.
- The files are not locked, so you can edit all parts freely.
- I left empty spaces inside so that you can make your adjustments.
- If you need support, read my blog or book a consultation with me.

Financial Statements
Income Statement
The income statement shows the company's revenue, expenses, and profitability over a specific period.
Cashflow Statement
The cash flow statement shows how much cash a company has generated or used during a specific period, from operating activities, investing activities, and financing activities.
Balance Sheet
The balance sheet is a financial statement that shows a company's assets, liabilities, and equity at a specific point in time, providing a snapshot of its financial position.
Financial models as planning tool
A management tool
Financial plans are a powerful management tool with a wide range of applications, including strategic forecasting, company analysis, sensitivity analysis, and scenario analysis.
Part of a business plan
A financial plan is a valuable tool that can help you assess the potential of your business idea by estimating its earning potential and the capital requirements needed to make it a success.
Part of a business case
A financial plan is a powerful tool that can help you assess the potential impact of a new product line or capital expenditure (Capex) on the overall performance of your company.
The fundamental elements of this financial plan template
Please download the financial plan example of my fictional company, “OpenOffice.Solution”. The examples shown below refer to changes I made to the template to forecast the sales of office chairs. Link in the download section.
Here, you forecast the revenues of the company.
The template has no logic behind the revenues, so you can add your assumptions to the assumption page and make the related calculations on the calculation sheet. Please make sure you link the values to the correct files in the Statement.
ReneOffice.Solution Example:
Assumption Sheet:
- Define three products
- Define product prices by year
- Define sales volume by year
Calculation Sheet:
- Link Price per Products
- Link Sales Volume
- Calculate Revenue (Price * Volume)
Here, you forecast the related cost of your services or product sales.
You can do this as a revenue percentage or based on fixed volume and costs. This mainly depends on how you generate revenue.
ReneOffice.Solution Example:
Assumption Sheet:
- Define purchase cost per unit
- Define shipping cost per unit
Calculation Sheet:
- Link Sales Volume from Revenue
- Link Purchase cost per Unit
- Link Shipping cost per unit
- Calculate Purchase Cost (Cost & Volume)
- Calculate Shipping Cost (Cost & Volume)
Opex in a basic 5-year financial plan is pretty simple, as these are usually fixed costs; we enter our expected values. I want to make the staff and marketing expenses more detailed. This can provide partners/investors with valuable information on how we want to grow and how we want to reach our clients.
Just so you know, how many lines of operating expenses you want to show is up to you. But I would focus on the essential parts and summarise the rest under “others”.
ReneOffice.Solution Example:
Assumption Sheet:
- Staff expense by department and year
- Marketing expense by marketing channel and year
- Other operating expenses by year
Calculation Sheet:
- Sum of Staff Expenses
- Sum of Marketing expenses
- Sum of Other Opex expenses
I provided you with a basic capex model, which summarises all the capital expenditures into one value per year and comes with a straight-line depreciation.
In reality, assets such as computers, warehouse equipment or production tooling would all have different depreciation schedules. I also got templates for that, but we simplified it into an overall value in this case.
ReneOffice.Solution Example:
Assumption Sheet:
- Enter the useful life of the assets, which means over how many years will the depreciation be calculated
- Enter the investment values per year.
Calculation sheet:
- There are no changes; use the basic model.
With this schedule, we forecast the outstanding balances and inventory balances.
We usually get paid within a few days or weeks after making the sale. It takes time until the credit card transactions come into our bank account. On the other hand, we also have bills, which we have to pay within a few weeks.
We, therefore, enter the “days” of the payment terms to estimate the values.
In the case of the inventory, we say how many days a product is in our warehouse.
These values are highly speculative for an annual model and give us a rough estimation. Unfortunately, a yearly model needs to reflect better the initial cash investments into inventory. So, the cash balances need to be used carefully.
For more detailed estimates, I recommend using a monthly financial plan. However, this type of forecast is sufficient for the initial evaluation of a business idea.
Example ReneOffice.Solutions
- Accounts Receivable range from 30-40 days
- Accounts Payable range from 40-50 days
- Inventory Turnover, from 100-80 days
The template includes a basic debt schedule, which is based on flexible debt issuance and repayment schedule.
We define the annual interest rate, which is applied to the average debt outstanding.
Next, we forecast the debt needed to finance the operations each year.
If we pay back debt, we enter a negative value.
I recommend doing the debt and equity schedule as the last step. The cash balance in the cash flow statement can not be negative.
Example ReneOffice.Solutions
- Entered new credits for the first two years
- Repayment starts when the operations are positive, in this case, years 4 and 5.
This logic is similar to the debt schedule. We enter the amount of capital we or other investors plan to invest in each year.
The dividends are entered as a negative value in the year; we plan to take out profits. If they don’t take dividends, the earnings stay within the company and are reflected in the cash balance.
I would recommend doing this part last together with the Debt schedule. First, forecast the business operation and then evaluate the funding.
Example ReneOffice.Solutions:
I put the initial investment in the first year and then added a dividend after the cash balance was sufficient.
For this template, I used a basic tax forecasting method. If the company is profitable, then a tax rate applies. This does not consider any forward-carried losses or tax refunds.
Version History
Version 1.2
Updated March 2024:
- Added a 36-month financial plan template to the free selection.
- The 36-monthly financial plan enables more detailed planning of the expenses and revenue streams, which is particularly helpful for startups and project ramp-up.
Version 1.1
Updated Jan 2024:
- Working capital schedule from % to days outstanding.
- Debt schedule was changed from fixed loans to a more flexible and simple debt schedule
- Removed file lock. (Yes, it was locked before)
- Added standard declaimer
Version 1.0 was released Nov. 2023
Get access to the free templates
You will receive an automatic email with access to the templates.
You will also receive updates and information about my latest explainer videos and templates.
My financial modeling services
Review your
Financial Plan
-
Review calculations
-
Video calls for Feedback
-
Suggestions
Financial Plan based on Templates
-
3 Statement Model
-
Up to 60 months Forecast
-
Customized Revenue Models
-
Modular Template Design
-
Remote Workshops
Customized financial plan
-
3 Statement Model / Business Case Project Finance
-
Fully customized timeline
-
Tailored to the business model
-
Workshops & Trainings
-
Historic financial performance analysis