
Download a free financial plan template
Table of Contents
When we think about financial modeling, one of the most used tools to forecast the performance of a company is the three-statement financial model. Its relevance comes from many different factors, starting from its flexibility and customization to the fact that it is extremely useful both for startups and established companies.
The three-statement financial model is a tool mainly composed of the three financial statements: balance sheet, income statement and cash flow statement. However, the model goes far beyond the numbers expressed on these statements, as it is used to forecast all the relevant aspects of the business activity in the next years while running scenario analyses and drawing relevant conclusions.
As a matter of fact, many established companies use the three-statement financial model to forecast revenues, costs, taxes, interest payments and much more for the next 3 to 5 years, yielding precise estimates using historical data. On the other hand, smaller startups might use this financial model to show the potential of the firm and to better explore different funding opportunities to ensure the best chance of success for the business activity.
Financial Modeling Basics: Structuring the Model into Schedules
Because building a three-statement financial model is an extremely long and arduous task, it is always better to split the entire model into smaller sections, called schedules. These schedules do not only serve the purpose of separating the model into smaller pieces to make the model easier to read, but they are also extremely useful to make all the necessary calculations on.
This is because the three-statement financial model is composed of many different factors, including three financial statements, related analyses and conclusions. So, to ensure that the end product is as clear to understand as possible, it is necessary to perform all the complex calculations in a separate schedule and then simply referencing the correct value from the schedule to the final statement.
By doing so, whenever an investor or a manager wants to understand why, for example, the operating costs in a given year skyrocket, instead of reading between the lines of claustrophobic financial statements, they will be redirected to the cost schedule containing all the needed details in a neat and organized manner.
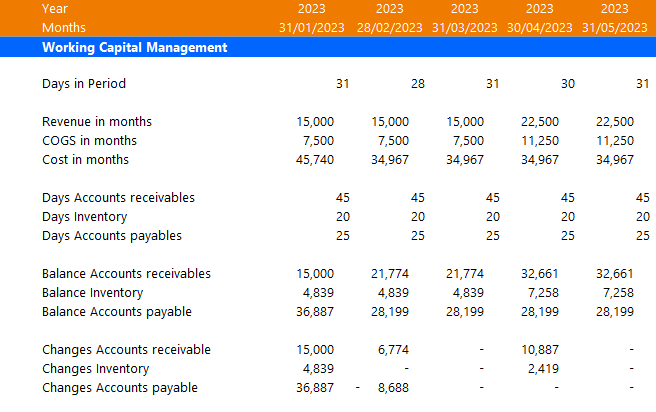
One of the fundamental schedules in every three-statement financial model is the Working Capital Management Schedule, of which you can see an example below. Depending on the complexity of the business and the years of activity, the working capital management schedule might be more or less complex than the example below, but regardless keeping a close eye on working capital is fundamental as it a measure of the company’s operational efficiency and short-term financial health.
Model buildup Sequence
When it comes to building the three-statement model, I always use a methodical and ordered approach to ensure that each portion is well integrated in the model and that every number contributes in a significant way to the financial modeling and forecasting.
Now, I am going to discuss the steps I take to build most of my three-statement models, ensuring the highest standards of quality and accuracy. However, it is important to note that the following steps may vary depending on the client’s needs and business model.
1. Build the Header Line
The Header Line, or timeline, is the first step in building any type of model as it frames the whole business activity into specific periods that can then be used for calculations and forecasting.
Additionally, considering that, usually, a three-statement financial model is used to forecast and analyze the next 3 to 5 years of the business activity, the excel model should always contains both an annual and a monthly sheet, so that they can both be used to analyze a specific period of time and to grasp the full picture.
2. Create the Statement Structure
Then, the second step is building the statement structure, meaning the framework of the balance sheet, income statement and cash flow statement. By building the structure of the financial statements in advance, you will be able to have a clear understanding of the final results without having the excel model full of numbers.
Also, I personally find it very convenient to build the structure in advance because this way when I have crunched all the values, I am able to insert them in the model right away, instead of going back and forth between calculations and building the structure.
3. Develop the Assumption Sheet
Even though completing the assumption sheet is an ongoing process throughout the development of the three statement model, it is necessary to build the structure and lay down the basic and necessary assumptions as soon as you can.
The assumptions sheet is often regarded as one of the most important parts of the model, so it useful to be able to take a look at it even while building the excel model.
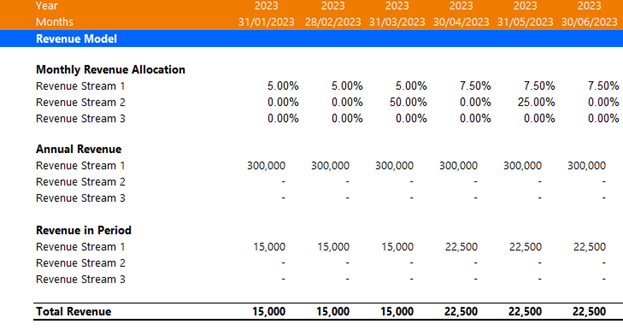
4. Revenue Schedule
After the preliminary steps are taken care of, it is time to start filling the model with numbers. The Revenue schedule is the worksheet in which all the revenue streams are displayed, together with their annual revenue and the monthly revenue allocation.
Thanks to this schedule, it is possible to calculate the revenue per period for each of the periods in the model.
5. CoS & Cost Schedule
Then, it is necessary to build the Cost of Service Schedule, containing all the details, expressed on a monthly basis, about the costs incurred by the company. Among other things, the cost schedule highlights the cost of goods sold (COGS) as a percentage of the revenue per period, and then calculates the costs incurred each month.
Additionally, depending on the business model, the cost schedule also contains the cost of staffing, differentiating between role based staffing (e.g. CEO, sales lead, etc.) and department based staffing (e.g. marketing department, etc.)
6. CAPEX and Depreciation Schedule
After completing the cost schedule, we can start filling in the income statement and calculating the Earnings Before Interest, Taxes, Depreciation and Amortization (EBITDA). Then, it becomes crucial to develop a Capital Expenditure (CAPEX) and Depreciation Schedule to continue with our model.
This schedule is used to calculate the depreciation on Property, Plant & Equipment (PP&E) incurred each period, and to record the capital expenditures of the company.
7. Tax Schedule
By subtracting the amortization and depreciation expense from the EBITDA, we obtain the Earnings Before Interest and Taxes (EBIT). So, at this point it becomes essential to create the Tax schedule to inch closer to the completion of the Income Statement and calculating the net income.
On the other hand, the most attentive readers would have realized that to calculate net income you must subtract the interest expense from the EBIT before calculating and subtracting the taxes, but as you can see, the debt schedule is in the very last places of this list.
This is because, especially with startups needing funds, net income is first calculated assuming an interest expense equal to zero to estimate the funding needs of the company. Then, the debt schedule is built based on the need for borrowed funds, and finally, we will loop back to the income statement correcting the interest expense.
However, for established companies that do not need to borrow funds from the debt market, it is possible to complete the income statement right away by fixing the exact amount of interest expense.
8. Working Capital Schedule
The working capital schedule is used to keep track of the current assets and current liabilities of the company, so the most common items contained in the working capital schedule are account receivables, inventory and account payables.
Additionally, by building this schedule, we are also starting to fill up the balance sheet and the cashflow statement, getting closer to the end goal of completing the three financial statements.
9. Equity Schedule
The equity schedule contains all the necessary information about the ownership structure of the company and how they use their retained earnings. The most common items tracked by the equity schedule are common and preferred share dividends, share issuance and repurchase, and finally, the amount of retained earnings.
10. Debt Schedule
As I briefly mentioned before, the debt schedule is the last one to be completed as interest is left as a variable to analyze the different financing alternatives that a company might pursue. Then, once the correct amount and method of funding has been estimated, it is possible to complete the debt schedule and fill in all three financial statements.
11. Scenario Linkup (if available)
Once the three financial statements have been completed, in some cases, it is possible to integrate the model with a scenario analysis, which studies how the Key Performance Indicators (KPIs) of the company vary, as one or more parameters change.
Despite it might not be possible for every financial model, a scenario linkup often provides extremely valuable information in case of an economic downturn or a substantial change in economic conditions. For example, it might be interesting for a company to understand by how much their net income could vary if the interest rates were to increase or if the cost of goods sold was to drop.
12. Summary Statement
After all the calculations and analyses have been completed, it is always important to draw some clear conclusions, not only for the sake of the model, but also to give the business the possibility to use the model in a pitch and to show it to their investors.
The summary statement contains all the key information and conclusions of the model, presented in a way that they can be understood at first glance by anyone.
13. Formatting
Finally, the very last step of building the model is making it look pretty! After all this work, the last thing you want is to have a difficult to read and colorless excel sheet filled with numbers.
It is always important to implement conditional formatting, input validation and a bit of color to guide the reader in inputting all the needed variables and to find all the useful information without too much trouble.
Conclusion
In conclusion, even if a complex model such as the three-statement financial model might seem intimidating at first, once you split it into smaller sections it becomes much easier than you expect.
Additionally, although there are many schedules, by tackling one of them at the time you will be able to inch closer to the final result without getting overloaded with numbers, functions and information.
In the world of financial modeling is the accuracy and understandability of the final product that matters, not the speed, so take your time and you will realize that after a couple of tries the three-statement financial model is not that complex after all!