
Download a free financial plan template
Formatting a Financial Model
When it comes to formatting a financial model, even though Excel is a spreadsheet program and we are limited in our layout options, there are many personal preferences and some universal guidelines established by the Financial Modeling Institute. However, with a few formatting features, even a spreadsheet can look great, and I will show you how you can achieve this result.
In this article, I will present my approach to formatting financial models, where the term “format” refers to how we format and build the MS Excel (or Google Sheets) file.
Introduction
Before we even start with the formatting, I want to emphasize that there is no right or wrong when it comes to format and layout, as each company or user may have personal preferences.
What is important is that there is a consistent format throughout the model and that it is clear which fields are inputs and which are outputs, to ensure that the financial model can be used even without the help of the person who created it.
Unfortunately, throughout my past experience, I have seen many models that only the creator could understand, so when the creator leaves the project, the model ends up in the Excel graveyard.
I hope that in this article you will find some valuable information that you will be able to incorporate into your financial models to achieve a quality product that satisfies your client’s needs.
Now let’s just jump straight into this article where I’ll cover the following aspects:
Table of Contents
Part 1 – Calculation Flow
Excel is a pretty powerful tool as it does not require any particular arrangements to make calculations and its functions can take values from any position in the file as we can see in the example below:
Cell C6= F4*E8.
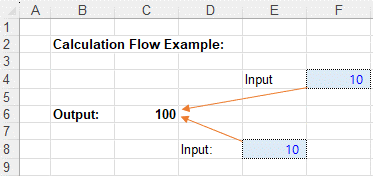
On the other hand, this aspect of excel makes it challenging for other people to follow the calculation and audit the model, so when building a financial model, we have to think of how other people will use and review it.
Therefore, I recommend making simple calculations and avoiding complicated nested functions, like an “if” function with 10 conditions.
Additionally, I like to build calculations in an ordered way, from the top to the bottom of the sheet, and to organize time periods from left to right, making sure that the end result is clear and standardized.
Here is an example:
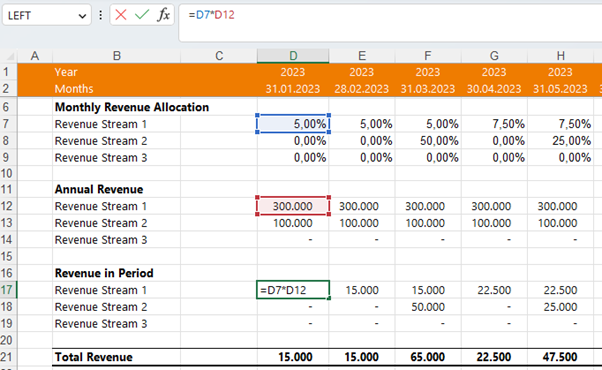
As you can see from the above example, all calculations are basic functions and multiplications, and all values are taken from the respective assumption tables using the “Lookup” function to minimize references to other tabs and nested functions.
A sure way to get lost, for example, would be to take values from another Excel tab with absolute references, so the client would have to switch tabs to see if the calculations are correct.
As stated earlier, Excel is a powerful tool that does not care if you use 100 or 500 rows for your model, so if there is a way to break the calculation into smaller steps, do it! You will often find that these smaller steps can also provide additional insight for the model drivers.
In the next part, I’ll show you how to structure a model so that even 1000 lines is not overwhelming.
Part 2 – Sheet Structure
Sheets are a great way to structure your financial model because they allow users to quickly find the information they need. Therefore, depending on the client’s objectives, they may need to be structured differently, so make sure you adapt them to your customers’ needs to a achieve a better end result.
Generally, my models contain these 3 types of sheets:
- Input Sheet, this is where we put in all assumptions/inputs of the financial model.
- Calculation Sheet, this is where all the calculation are done.
- Summary Sheet, this is where the users can find all the results of the model.
It is important to note that the client cannot change values in the calculation and summary sheets, as they only contain links and calculations. However, clients have access to the input sheet to run the model.
As an example, I will share with you the sheet structure I used for one of my past Subscriptions Models:

- Cover Page / Disclaimer
- Assumptions
- User Cohorts
- Calculation
- Monthly Statements
- Annual Statements
- Valuation/Funding
From my experience, I would say that the most time-consuming sheets are the assumptions, the annual statements and the evaluation ones.
However, it is also important to remember that almost 80% of the calculations and data points in the model are not important to the user and decision maker, so a well-structured model should lead users directly to the critical information they are looking for.
Part 3 – Cell Formatting
Cell Formatting is another great way to guide the user through the financial model.
There are many different schools of thought about formatting, but I personally like to keep it a bit simpler, by not putting inputs and outputs on the same sheet together.
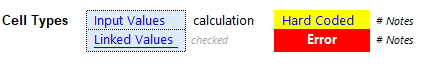
Input Values:
All of my input values are in blue, since blue has become the most commonly used color for these types of values nowadays. Therefore, I strongly recommend sticking with blue, as people have probably seen it in other models.
However, it is important to note that some other modelers add a yellow background color for the cells, but I prefer to use blue also in the background and to add a dotted line around the cell.
Calculations / formula cells:
I keep these cells in the standard black font color. This is done on purpose to let users know that in the calculation sheets there are no inputs.
Hard Coded Values:
Sometimes calculations or formulas are written over, or “hard coded”. In general, this practice should be avoided, but there are some situations where it is useful to hard-code a value.
For these types of cells, I make the background color yellow and the font color blue so that users can easily see which values are hard-coded.
Notes / Descriptions:
On the assumptions sheet, I often work with little notes, such as “Straight Line depreciation” or “even allocation over a 12-month period”.
When I include these types of notes, they are generally written in a slightly smaller font size and in italic.
Error / Checks:
In some parts of the financial model, I often build “checks” to verify that the inputs have been entered correctly and that the model is working properly.
For example, if 100% needs to be distributed over 5 cells, a simple check could be verifying if the total is 100%. If it is, the cell below will display “Check” in light gray, if not, the background color of the cell will turn red and show “Assignment missing”.
This type of check is done with Excel’s conditional formatting functions and is a great way to provide additional information to the user and ensure that the input values are correct.
Cross File Data:
Sometimes, it might happen that inputs or calculations come from other files. I usually try to avoid this to keep calculations simple, but for more complex M&A or project finance models this makes sense.
In this case, these fields are formatted like a input value (Light Blue Background, Blue Font), but the value is also underlined, to make it almost look like a hyperlink.
Part 4 – Headlines
When it comes to headlines, I like the saying: “if everything is bold, nothing is bold”, so I am a true believer that when it comes to headlines, often less is more.
In my financial Models I generally use 4 types of headlines:
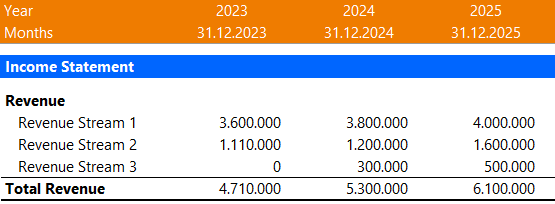
1. Time Periods
These cells contain the time periods and usually take the first 2 rows of a sheet. The cells in the time period headers have an orange background color with a white font.
2. Section / Schedule Header
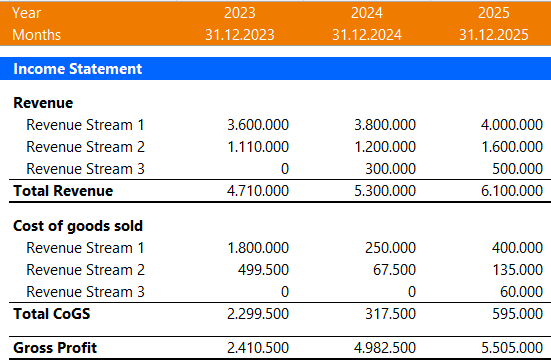
These headers determine the sections of the financial statements and of the individual schedules. So, for example, these headers can be used to determine the beginning of an income statement, cashflow statement and balance sheet.
These headers have a blue background color with white fonts.
3. Area Header
Area headings are used to explain the datapoint below. For example: User Cohort is the area header. They are defined by a simple bolded font with the same font size as the rest of the sheet.
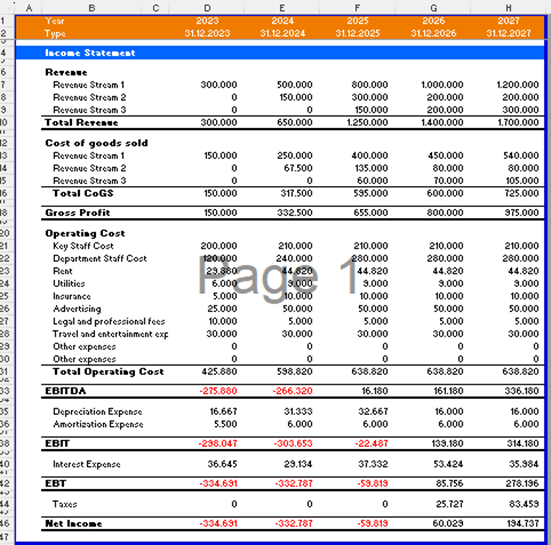
4. Important Outputs
This header formatting is generally used for the most important value in the calculation schedule, such as revenue or CoGS in Period, but it can also be used for other values that the user could find useful, such as Sales volume, number of subscribers.
The format of important output cells is usually composed by a bold font with a line above and below.
Part 5 – Grouping
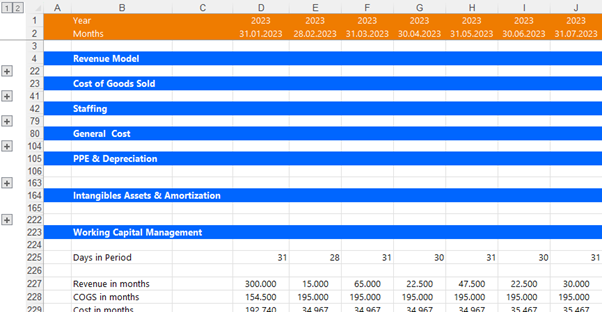
Considering that a financial model can have many rows, especially calculation sheets where data points can reach even 1000 rows, I recommend using the grouping function so that users do not have to scroll through all the rows of the sheet.
For example, I like to group each calculation schedule so that the user can expand or collapse the desired schedule just by clicking on the plus sign.
It must be said, however, that groupings can also become annoying if you use them too often. For example, I do not recommend groups in financial statements. So, if for example you have 20 rows of revenue sources (different products), it is better to create a separate sheet explaining the different products instead of grouping them directly in the summary.
Also, it is good to have different sheets for the details, as you can broaden the perspective by adding the percentage of revenue to the matrix.
Part 6 – Indent
I believe that the indent function is a great way to increase readability, so I often use it when building financial statements.
For example, cashflow from operations is an area header and all the line items below are indented, making it very clear that the following values are part of the cashflow.
Part 7 – Printing
Making the model printable enables you to share it as a PDF version, demonstrating that the model is well-structured and professional.
To make a financial model printable, use the Page Break Preview feature once you have completed your job. Then, depending on your time horizon and thus the “length” of your sheets, choose either a horizontal or a vertical page layout, whichever is most advantageous to your structure.
I would also recommend adjusting the margins a bit to get more out of the page, because even if sometimes it can be a bit difficult to get the page breaks right, it is definitely worth it.
Sometimes a financial statement forecast may be too large for just one page, so in these cases, it is best to put the income statement on the first page and the cash flow statement and balance sheet on the second page.
If you adopt my sheet structure and the timeline header is at the top as shown before, to finally print the page simply select in Page Layout -> Print Tittles the rows to repeat.
Part 8 – Data Validation
It might happen throughout your financial modeling career that some users unknowingly destroy your model by modifying or erasing the content of some cells when using it. Therefore, to reduce this fear and the risk of users actually destroying your work, you can use the data validation and sheet protection functions.
Data validation is a great way to improve your assumption/Input sheet by showing the users which kind of values they can enter in each cell when clicking on them. The most common examples of data validations are:
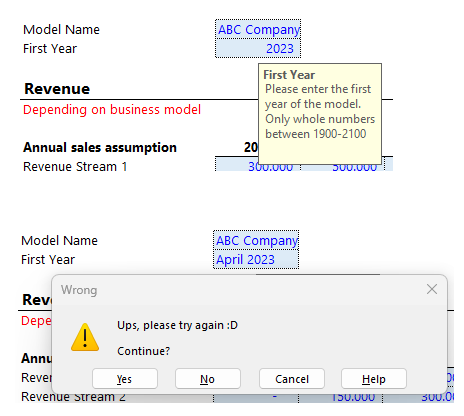
- Define the start year of your model as a “whole number”, maybe even better a “whole number between “1900 and 2100”.
- If you want to only insert a date in a particular cell, set the input value only as date format.
- For the cells in which you only want to insert numbers, allow only numbers to be typed in there. Sometime users write “N/A”, “TBD” or other comments in field, which would lead to errors.
- If you want a % allocation, set that the input number must be between 0 and 1.
- If something cannot be negative, set the restriction numbers >=0.
However, if you really want to make your model stand out, you should use the “Input Message” and “Error Alert” to guide users. This way, when the user selects the cell, a little popup comes up and tell the users which values they can enter. Additionally, this final method can also be extremely useful when teaching someone how to interact with the model.
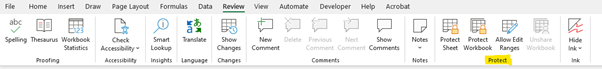
Part 9 – Sheet Protection
Sheet protection is the second method to curb misuse of the model. I once had a case where a client stated that the balance sheet was not right, but he could not find the cause. After a quick check, I found that he had replaced a formula with a hard-coded value, resulting in the imbalance. When I then confronted him, he insisted that it was a model error.
Since that day, I usually protect the “Calculation” and “Output” sheets with a simple password, which I then publish on the first page of the model.
For the assumption sheet, we can use “Allow Edit Range” to select the cells where the user should be able to change the inputs, while the rest of the file remains locked. This feature is especially useful to prevent adding rows or other elements that could ruin the final result.
Part 10 – Documentation
It is often the case that a financial model simplifies the business model of the company by grouping some elements together. For example, if a company sells 20 products, we may reduce them to 4 product groups in our model.
Additionally, sometimes the deal flow can be different among companies, so some models just consider sales volume while others are driven by website visits, conversions, and average order value.
Therefore, to give the user some insight into how you structured the model, I would recommend adding some simple illustrations of the revenue model and how the cost of goods is calculated.
I usually create these illustrations as part of the kick-off meeting with a client and copy them later into the model. It helps both parties, as both parties agree on a structure.